

about
Background
Today she runs Data Vedette, an independent consultancy for fashion, retail, and luxury brands on returns, affiliate and channel strategy, audience insights, and custom data tools. Charlotte is bicoastal, between Los Angeles and New York.
e-commerce analytics
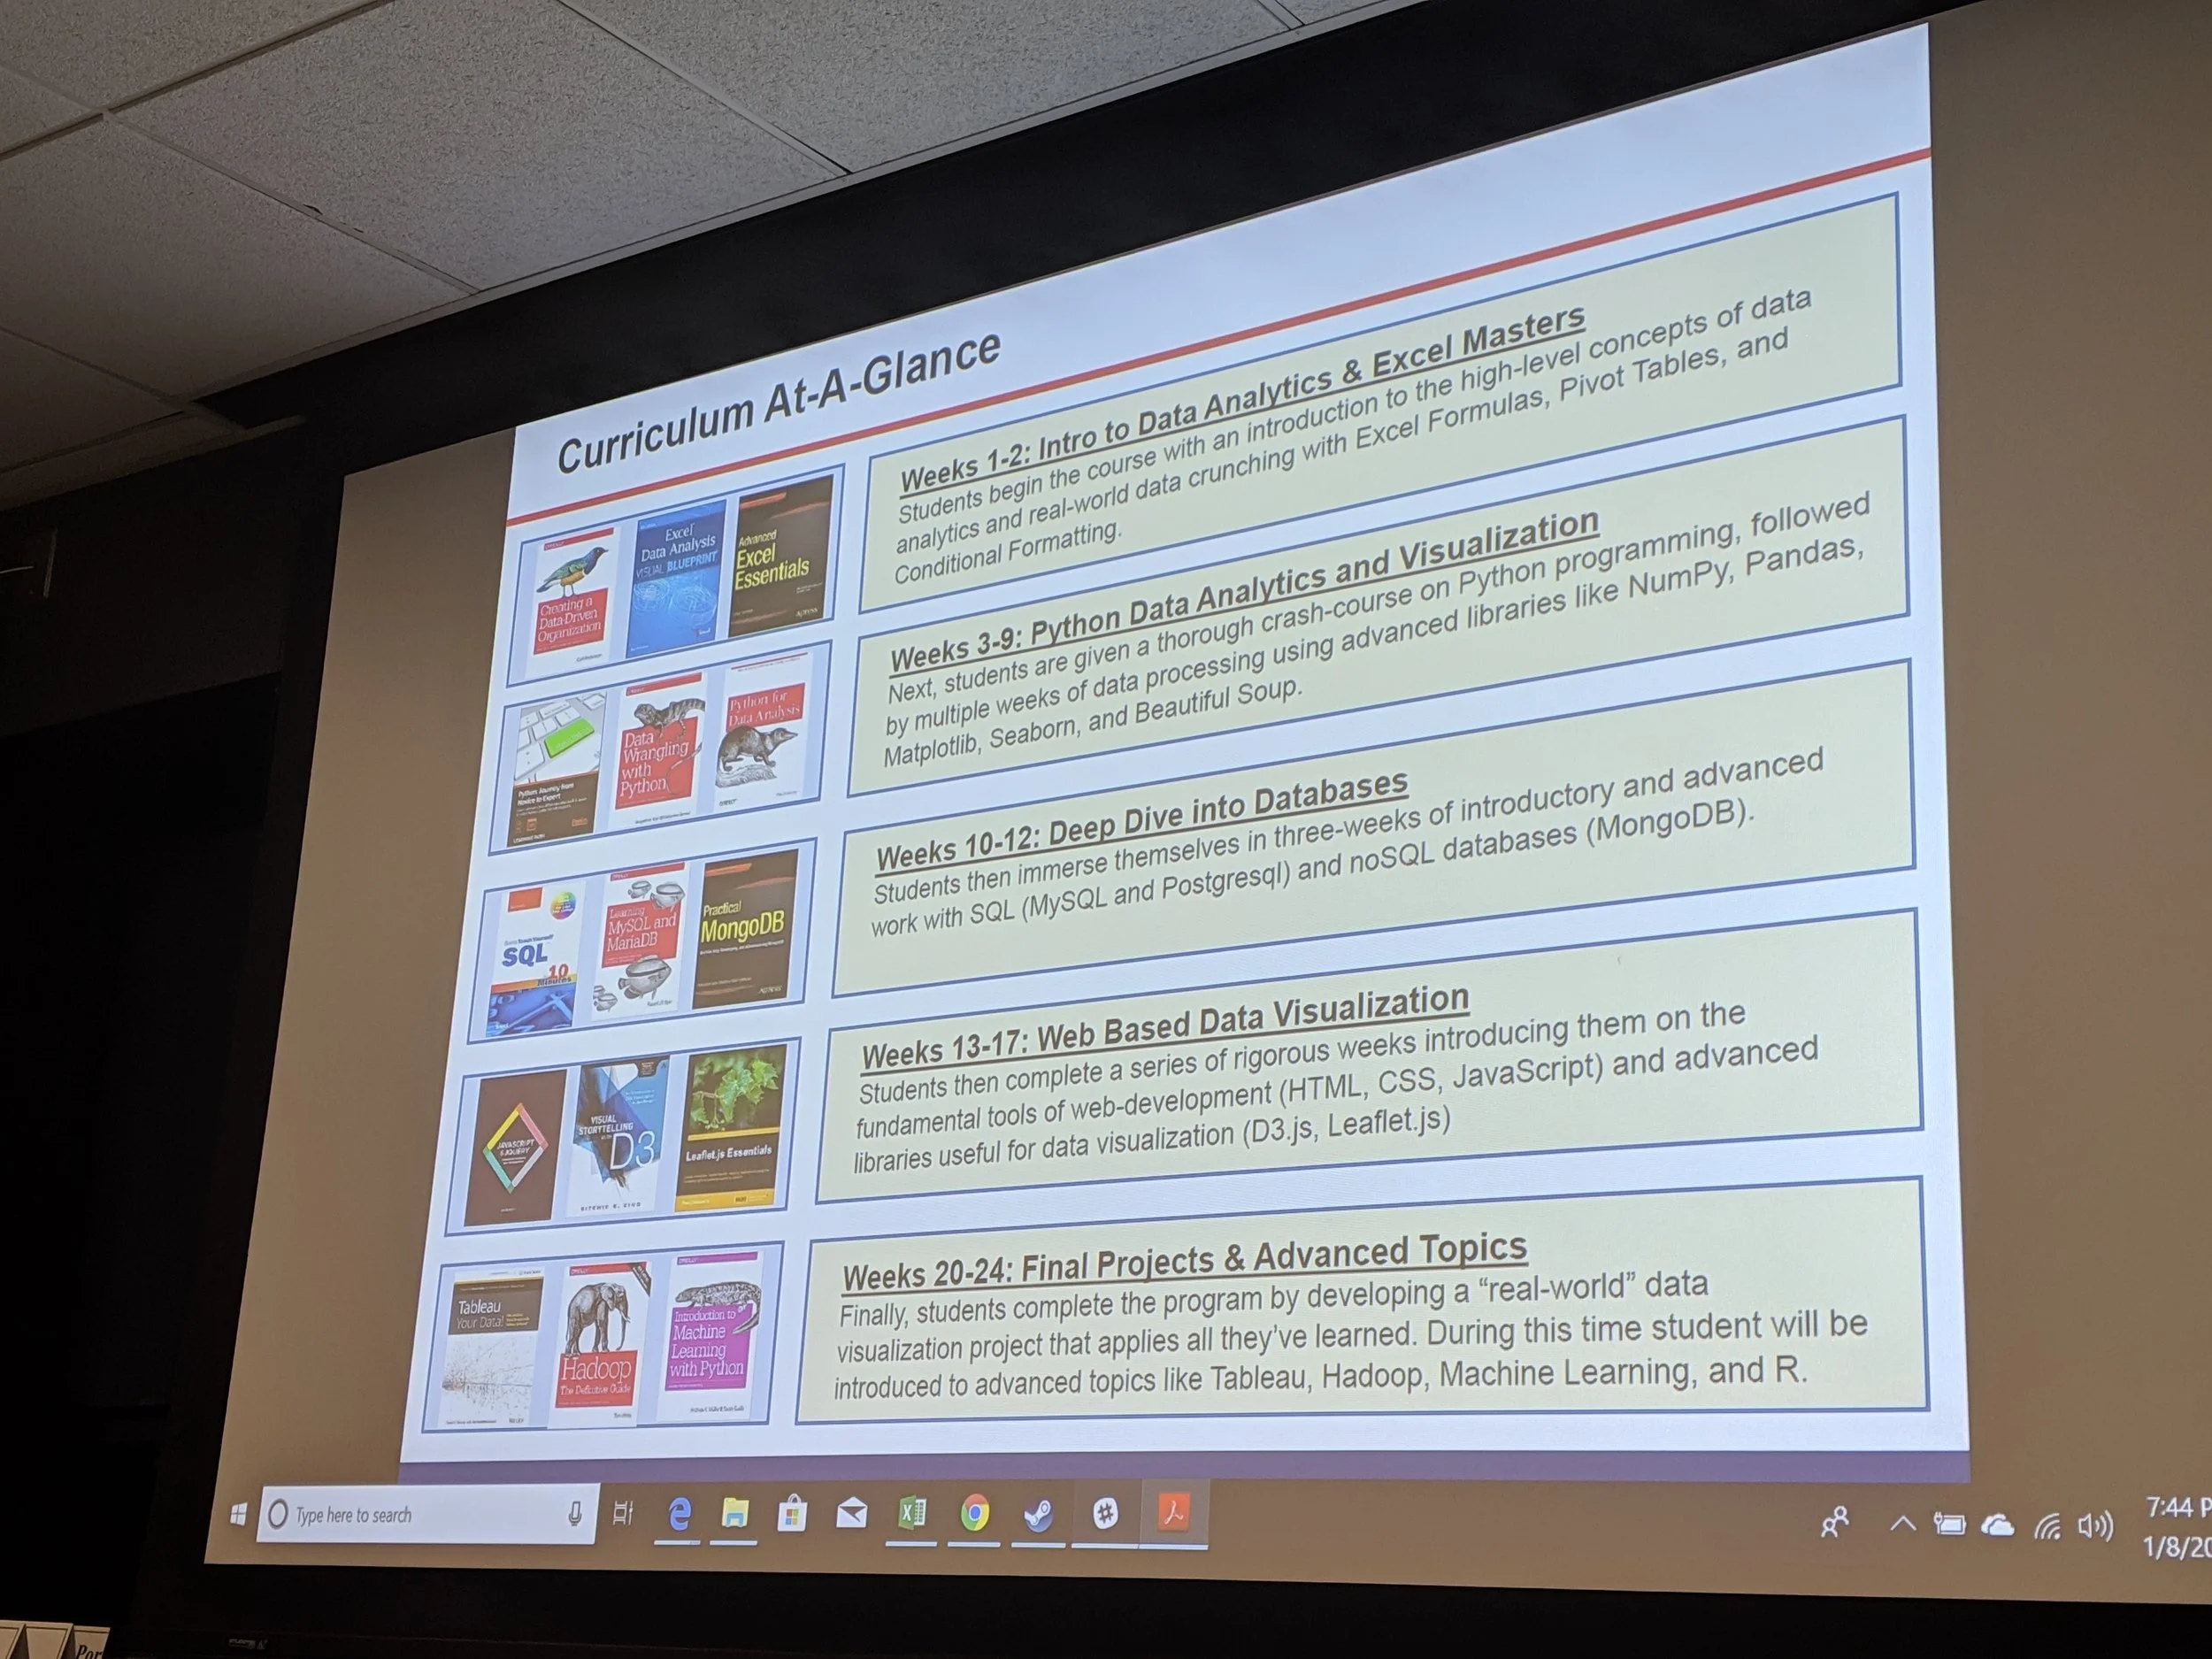
Charlotte earned a BFA in Photography from the Rhode Island School of Design (2011-2014). Her training in typology photography still shapes how she reads data, as a visual anthropologist looking for patterns. A growing passion for data led her to complete a Data Science Graduate Certificate at USC’s Viterbi School of Engineering Boot Camp in 2019. She went on to spend seven years with Who What Wear and Future Plc, rising from data intern to senior analyst for Who What Wear and Marie Claire in the Women’s Lifestyle division.

experience in publishing
Interpreter of business intelligence who turns data into creative strategy for growing brand loyalty and revenue. A data analyst with seven years in digital women’s fashion publishing, she brings quantitative and qualitative methods to e-commerce, marketing, content, and audience data. Her approach is anthropological: part data evangelist, part strategist, part multimedia creative.
Data Products
Who What Wear & Marie Claire
We redesigned an aging logistics hub, integrating autonomous robotics and IoT analytics to elevate throughput and reliability.
Every week for Who What Wear’s Fashion editorial team and bi-weekly for Who What Wear’s Beauty editorial team as well as for Marie Claire’s editorial teams, I lead the presentations on how we are pacing against our KPIs for Affiliate as well as analyze our content performance, provide data-driven insights into thematic performance, and offer strategy on how to lean into converting drivers. Along with the channel leads (Audience, Newsletter, and Social) we present findings to the editorial teams on how and further drive engagement and revenue based on what’s driving conversions and resonating angles to seasonal trends.
WEEKLY MARKET REPORTING
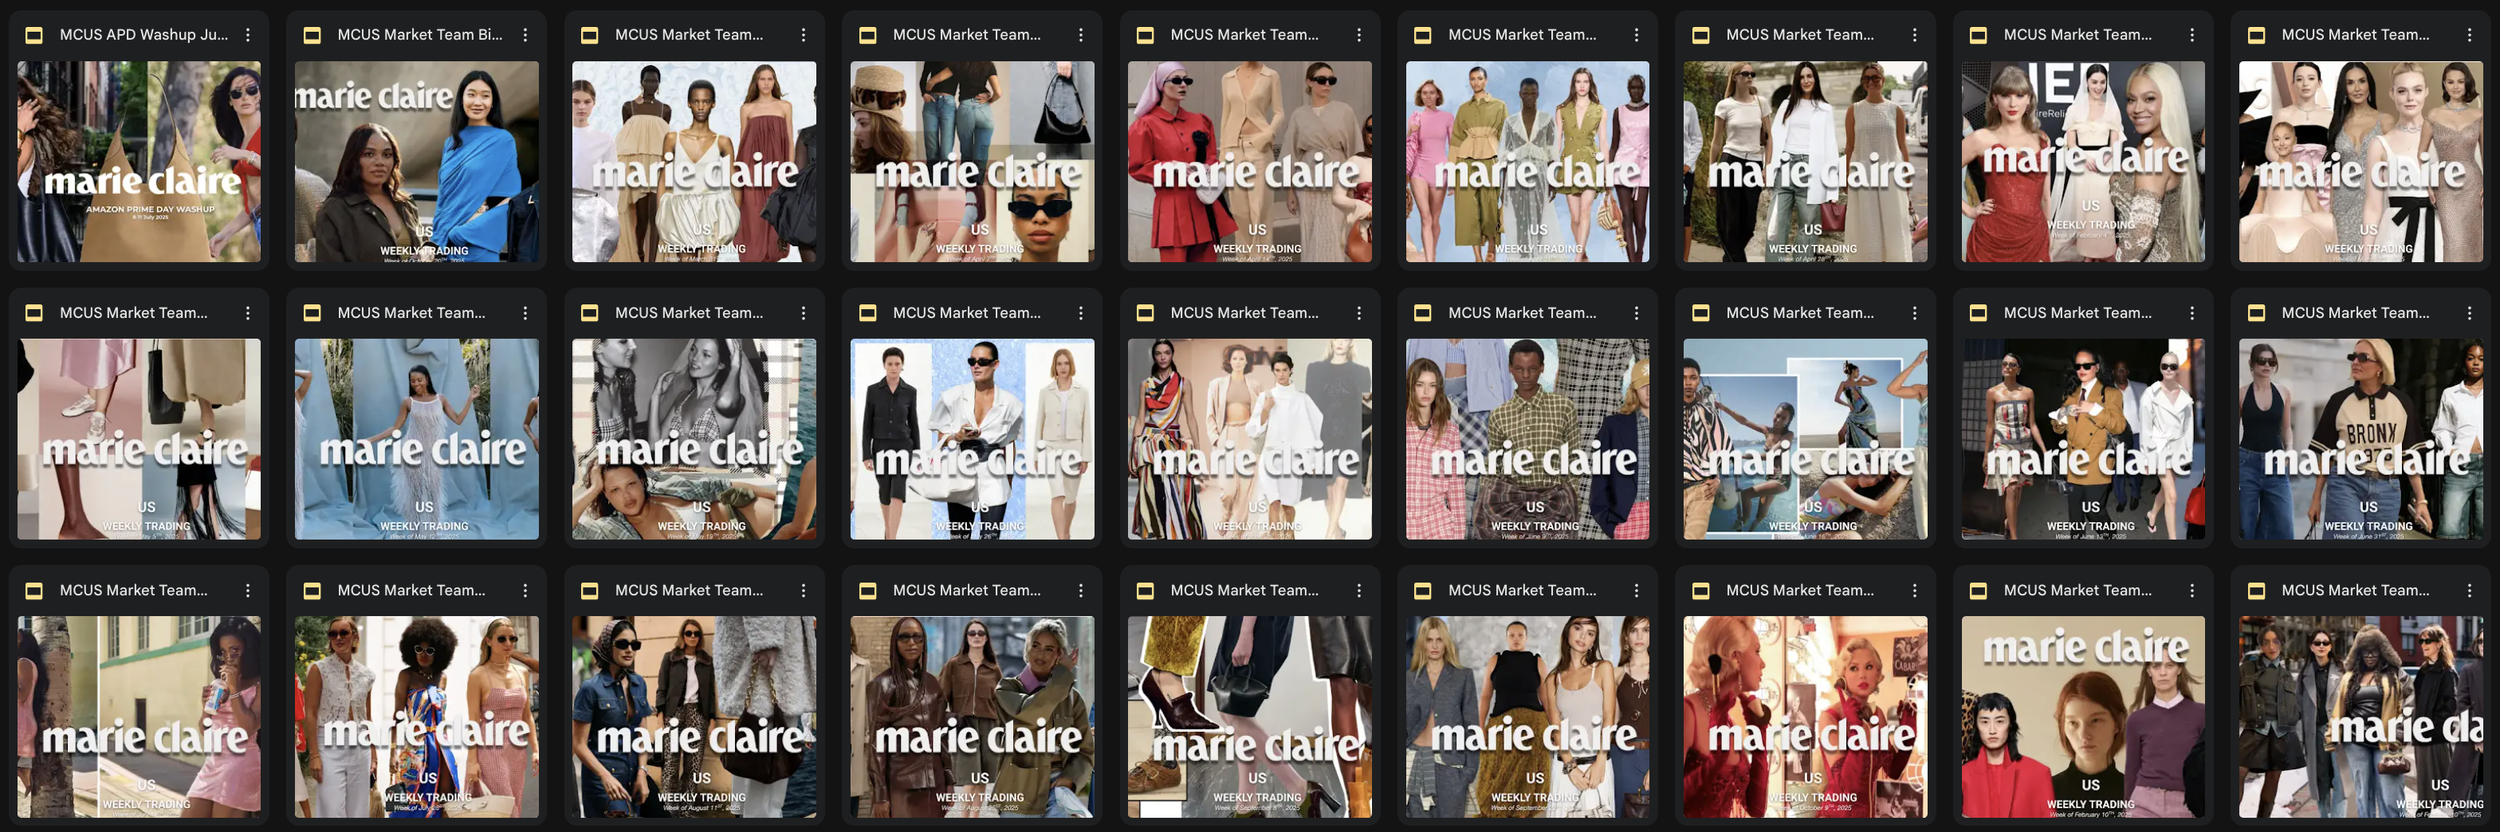
Every week for Who What Wear’s Fashion editorial team and bi-weekly for Who What Wear’s Beauty editorial team as well as for Marie Claire’s editorial teams, I lead the presentations on how we are pacing against our KPIs for Affiliate as well as analyze our content performance, provide data-driven insights into thematic performance, and offer strategy on how to lean into converting drivers. Along with the channel leads (Audience, Newsletter, and Social) we present findings to the editorial teams on how and further drive engagement and revenue based on what’s driving conversions and resonating angles to seasonal trends.
Playbooks & Content Strategy
Data Analysis
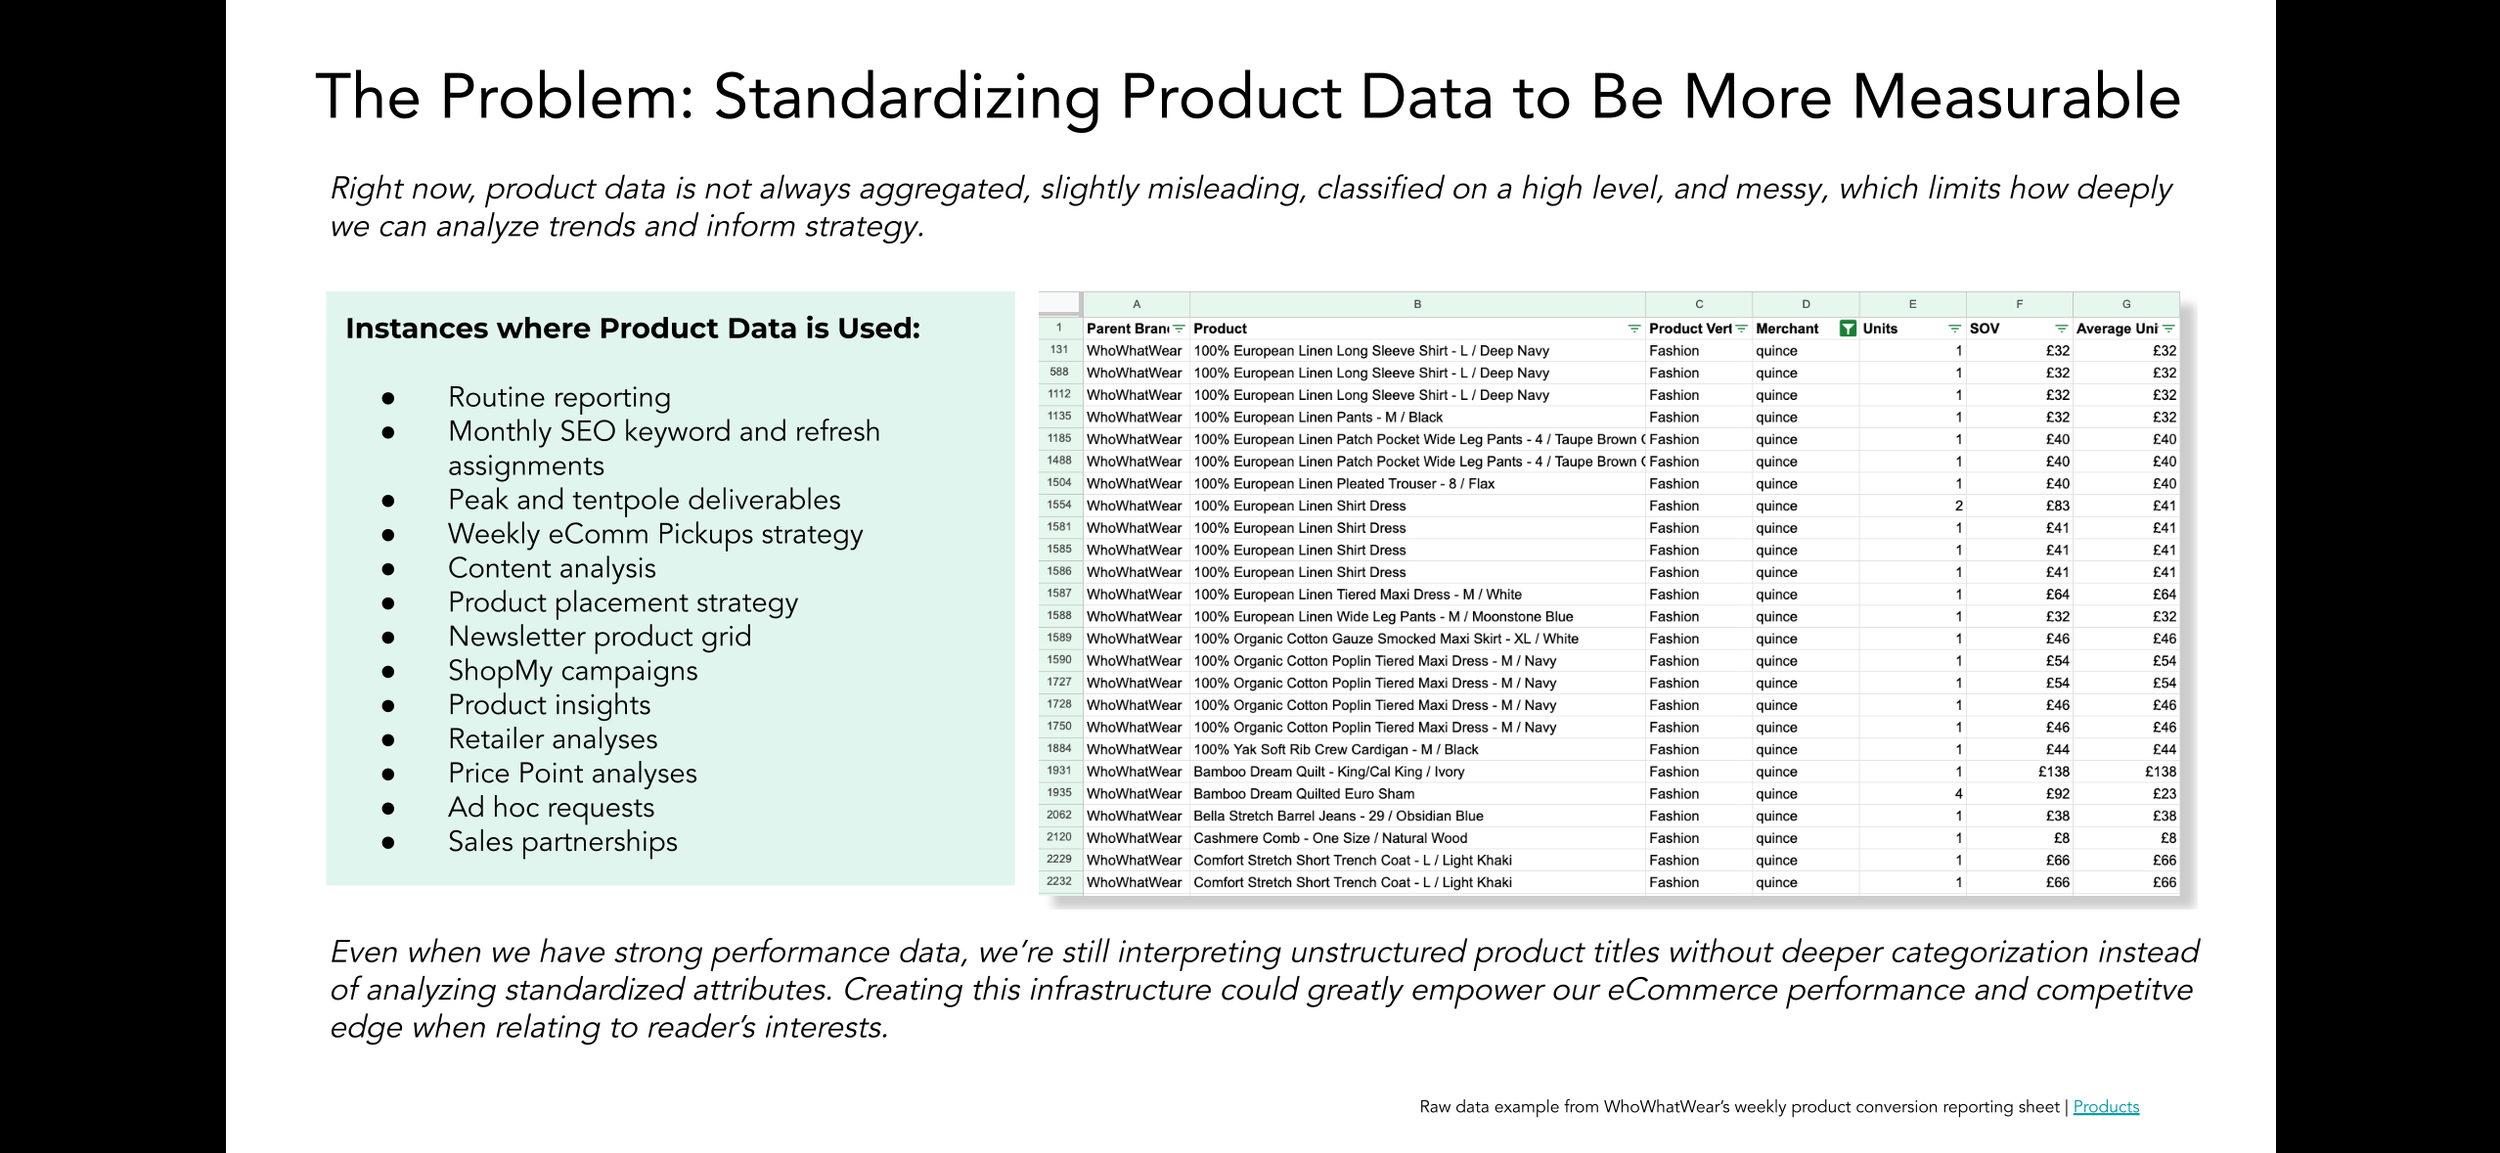
Standardizing data
We redesigned an aging logistics hub, integrating autonomous robotics and IoT analytics to elevate throughput and reliability.
We redesigned an aging logistics hub, integrating autonomous robotics and IoT analytics to elevate throughput and reliability.
Semantic Analysis
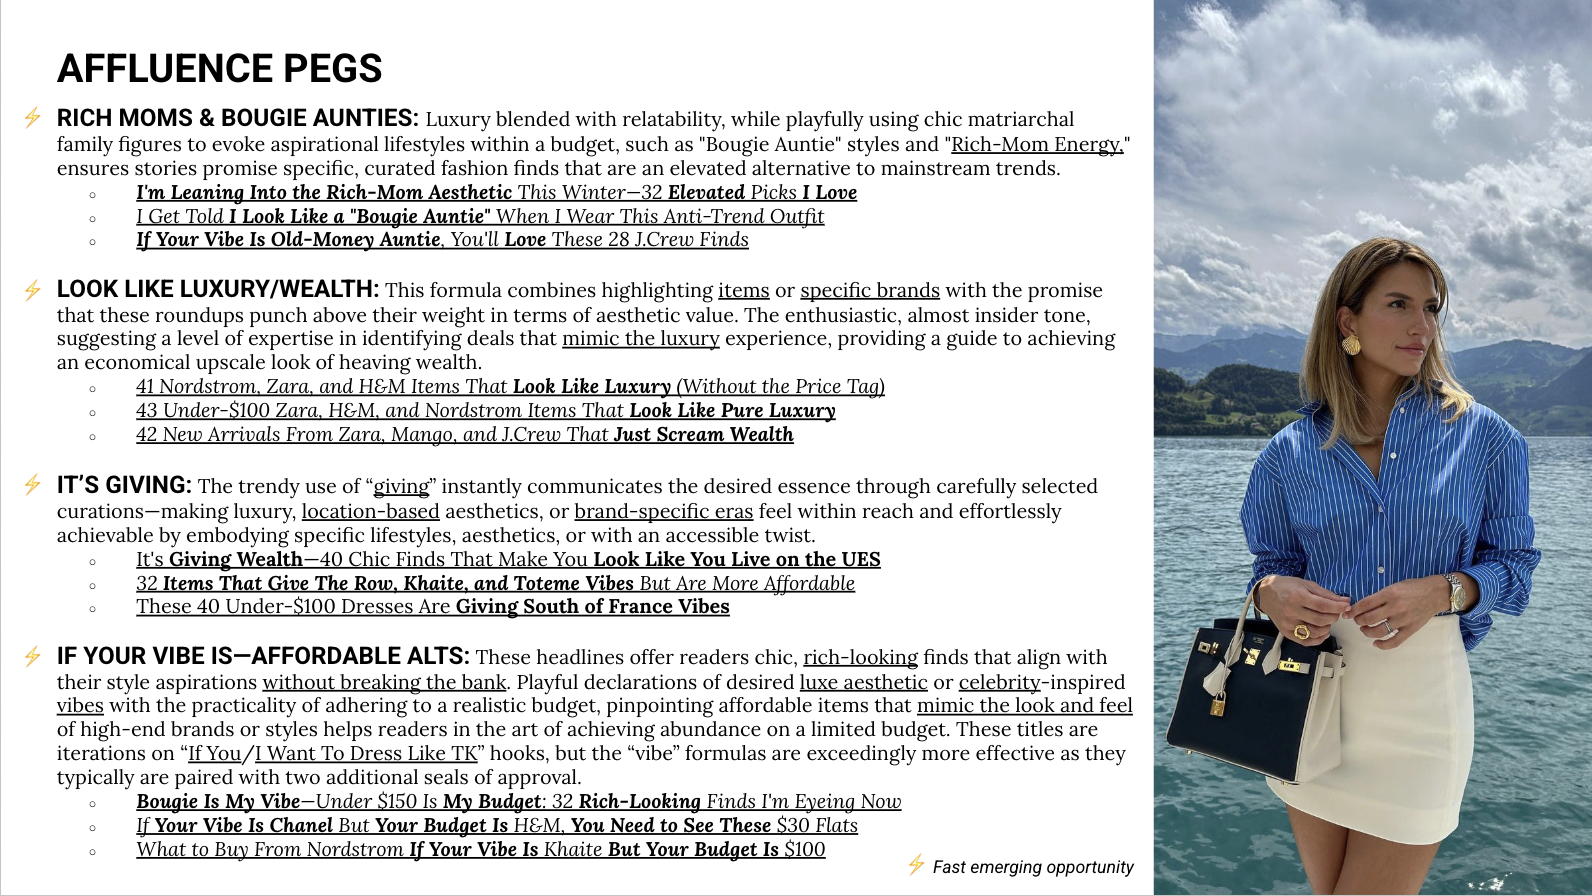
WWW used Domo, a business intelligence tool, that myself along with our Data & Analytics team built SQL pipelines, beast mode calculations, and dashboards with prior to the Future acquisition. These were used by stakeholders and our team for reporting data-driven, strategy, and business decisions. Domo was sunsetted and we now use Looker.
Trend Reports
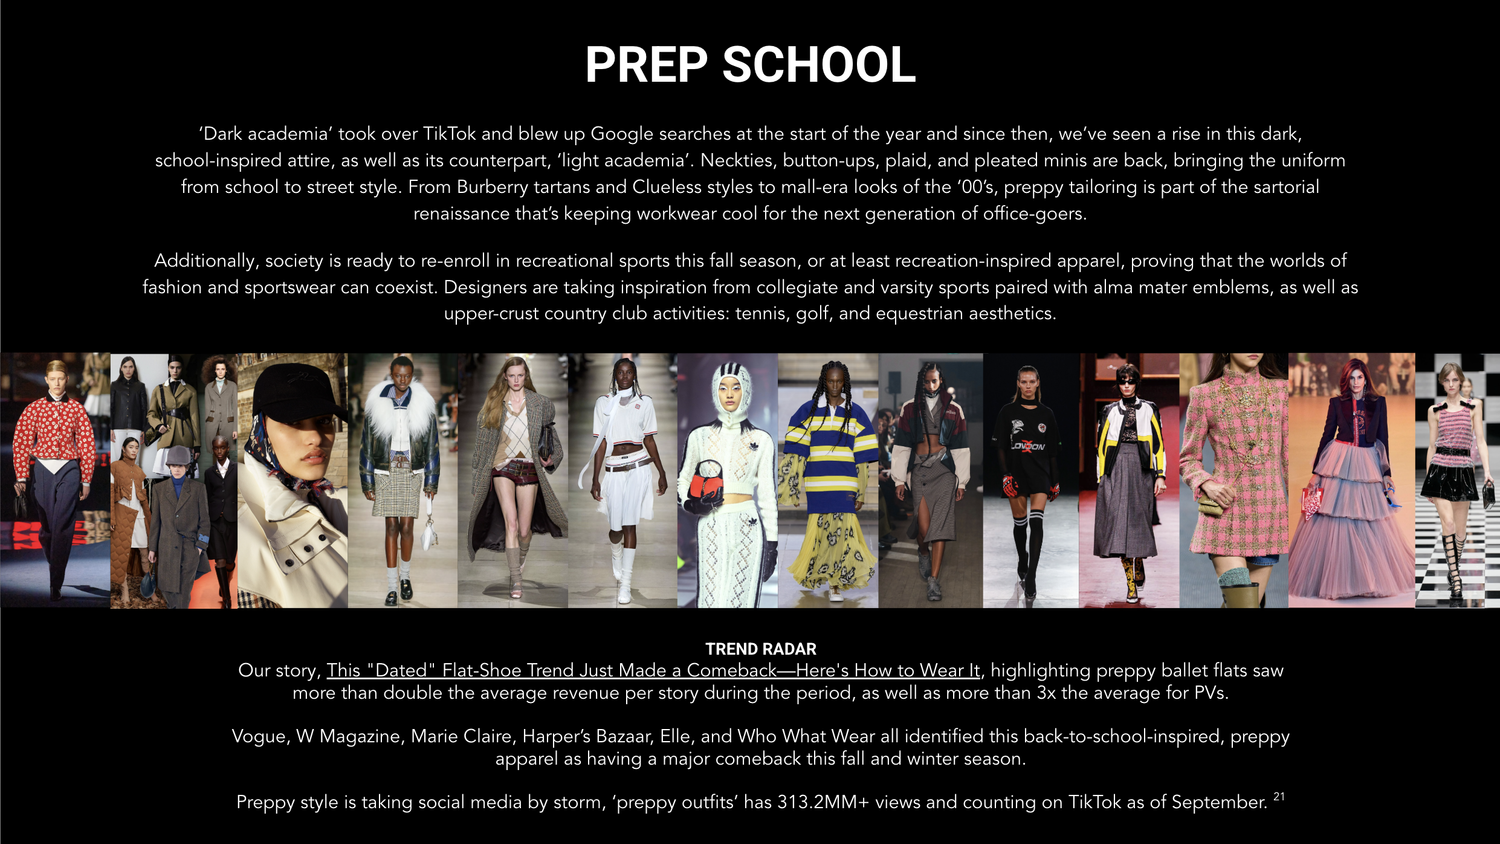
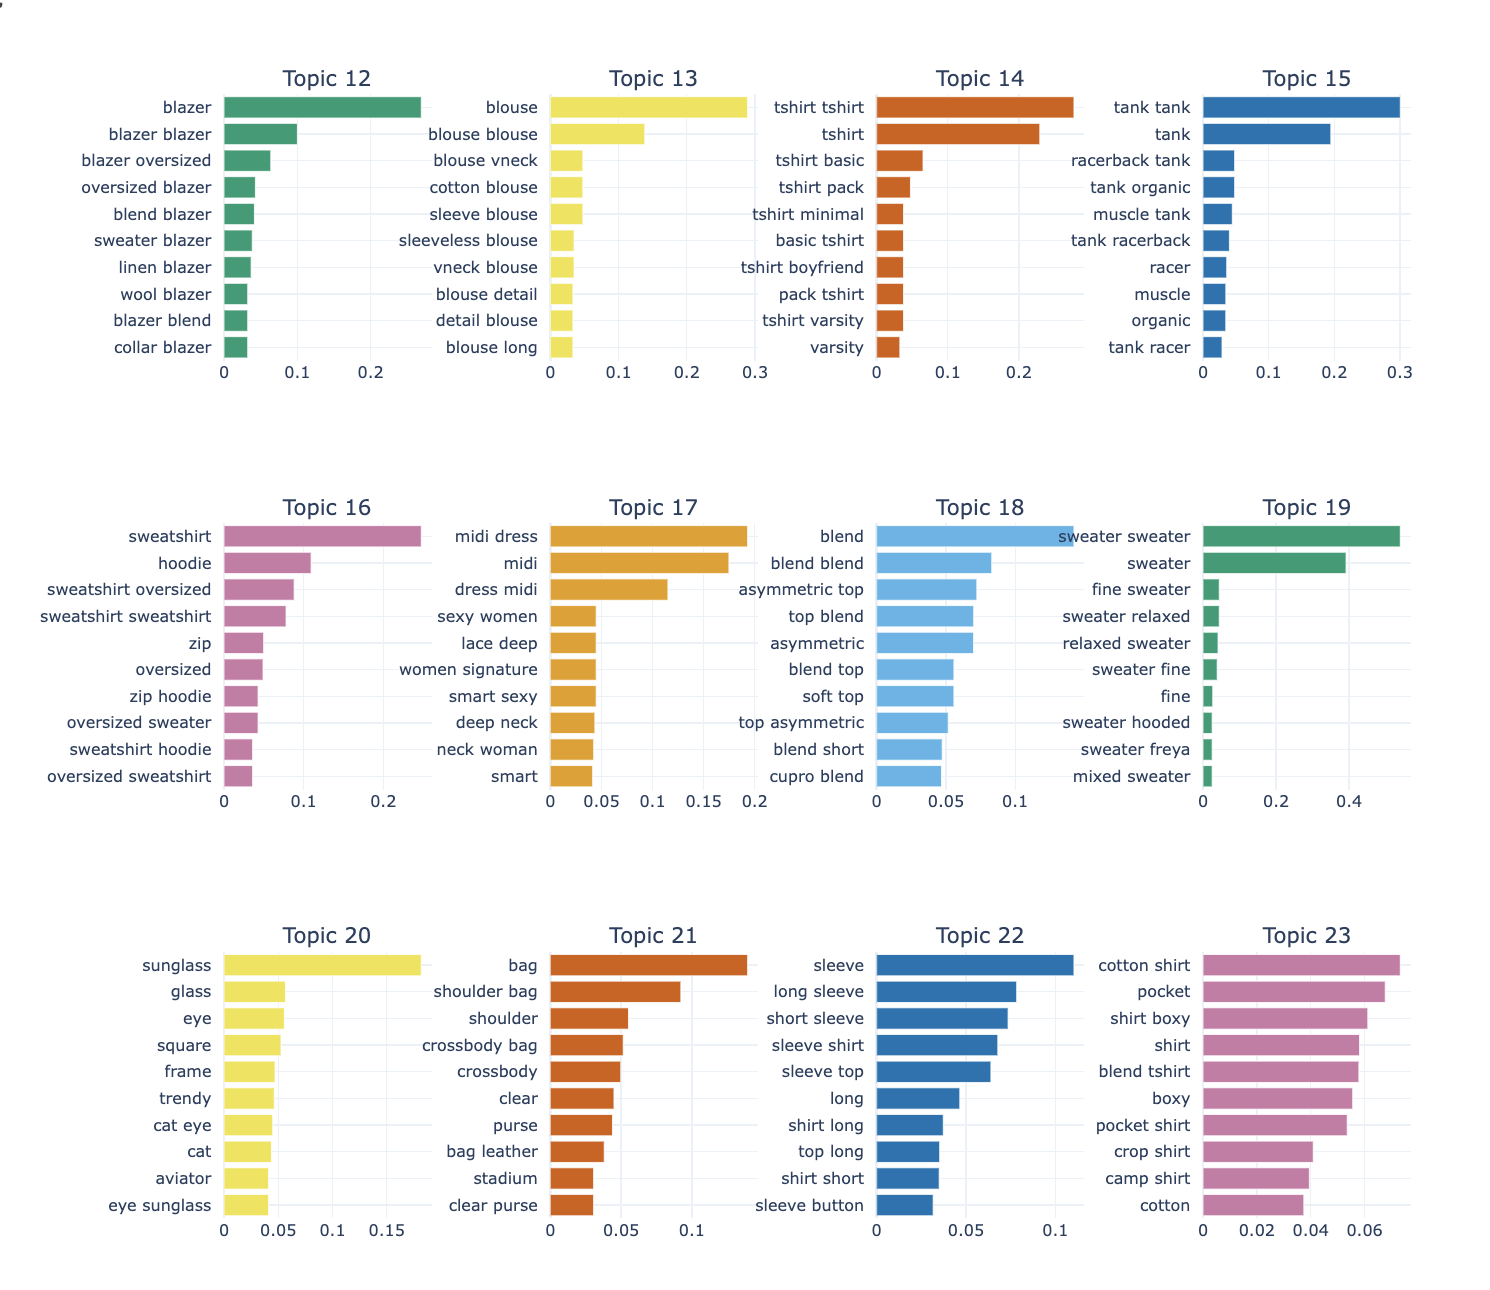
Topic Modeling
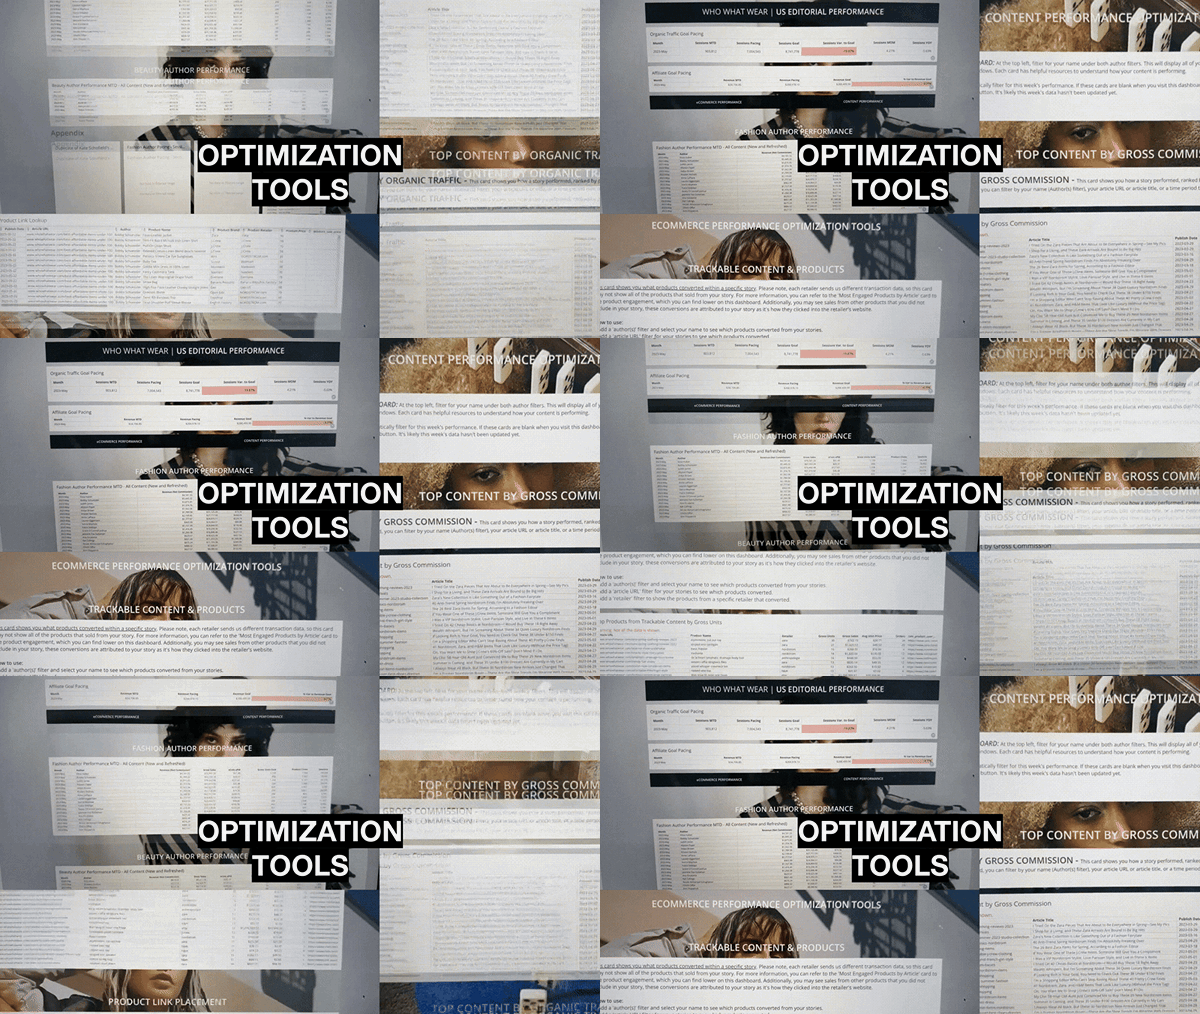
WWW used Domo, a business intelligence tool, that myself along with our Data & Analytics team built SQL pipelines, beast mode calculations, and dashboards with prior to the Future acquisition. These were used by stakeholders and our team for reporting data-driven, strategy, and business decisions. Domo was sunsetted and we now use Looker.
Dashboarding
domo & looker
WWW used Domo, a business intelligence tool, that myself along with our Data & Analytics team built SQL pipelines, beast mode calculations, and dashboards with prior to the Future acquisition. These were used by stakeholders and our team for reporting data-driven, strategy, and business decisions. Domo was sunsetted and we now use Looker.